Trust dashboard
Planon wants to ensure maximum customer satisfaction and offer an optimal working environment for its customers.
Therefore, Planon is committed to making sure that the customers' production environments are operational at least 99,5% (excluding planned maintenance).
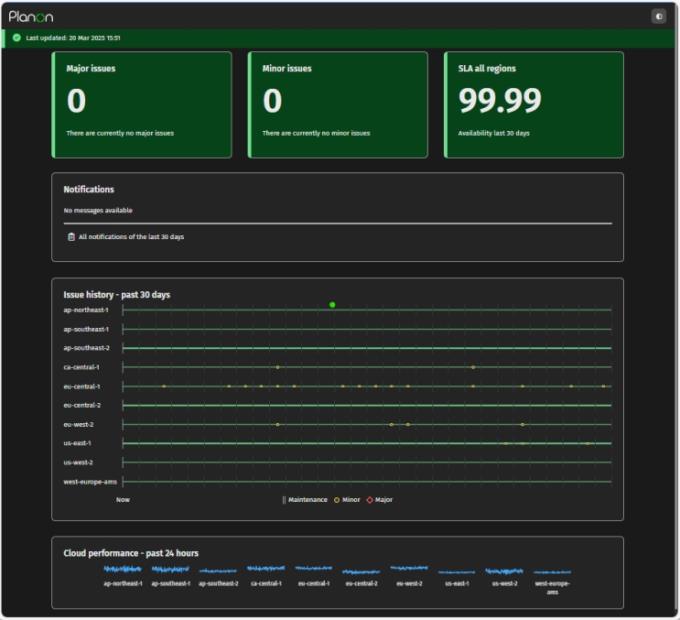
For transparency, Planon publishes a Trust dashboard that is available online (24*7). The dashboard displays:
• A switch (top-right) to determine the theme (Dark mode, Light mode). The system default uses the browser's settings.
• A date-timestamp of when the dashboard data was last updated.
• The average uptime over 30 days
• The number of major and minor problems
If there are major issues, the box is displayed red. Minor issues are displayed in yellow.
• Notifications panel, showing:
◦ Planned maintenance slots
◦ Information about incidents (major/neutral/minor)
• The uptime history (past 30 days)
If you hover over the issues, more details are displayed.
• Cloud performance per region
The Trust dashboard is compatible with Mobile devices. Essentially, the same information is available. The issue history displays 10 days and you can navigate backwards and forwards using the navigation arrows (<>). To view issue details, you need to tap the icon (instead of hovering over). |

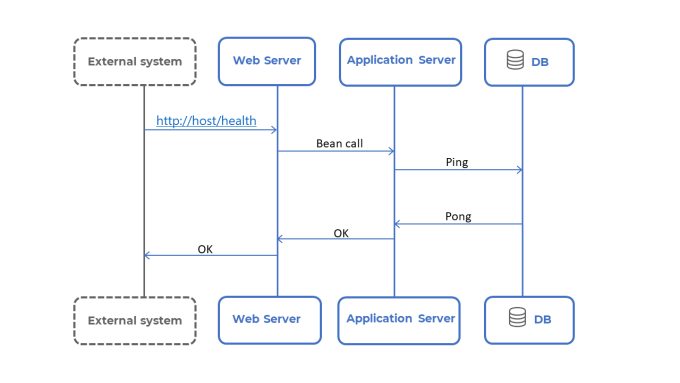
To be able to build the Trust dashboard, Cloud environments are continuously monitored, as shown in the following image:
