Stacking and blocking report
A Stacking and blocking report displays space usage over several floors in a building. In Spaces & Workspaces , you can access the Stacking and blocking system report by going to > and by clicking Report on the action panel. In the Reporting dialog box, if you select the System reports tab, you can select Stacking and blocking. The report can be edited, previewed, printed and saved using the action panel options.
In order to preview a report, select Stacking and blocking and click Preview report on the action panel.
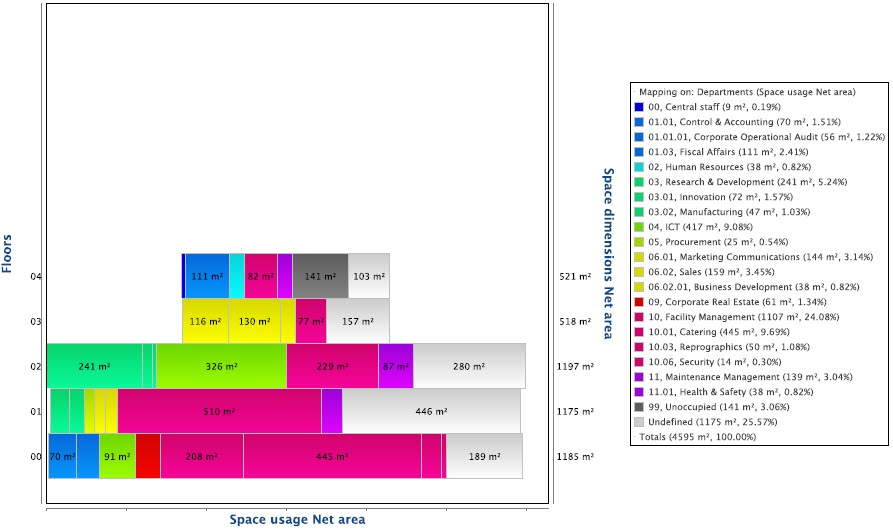
In the report, the floors of a property are displayed as horizontal bars. The mapping of the space usage on each floor is distinguished by various colors and the net area of the space usage is also displayed on the color itself. You can observe the black gradient color for the ground level of a property. The right side scale specifies the total net area of all the spaces of a floor. You can view the total net space usage area of a space mapping in the legend. You can also view the contribution (in %) of the mapping to the total net space usage.
In the report, the floors of a property are displayed as horizontal bars. The mapping of the space usage on each floor is distinguished by various colors and the net area of the space usage is also displayed on the color itself. You can observe the black gradient color for the ground level of a property. The right side scale specifies the total net area of all the spaces of a floor. You can view the total net space usage area of a space mapping in the legend. You can also view the contribution (in %) of the mapping to the total net space usage.
Click Edit report settings on the action panel to edit the report. A dialog box is displayed in which you can modify the following report settings.
Report settings:
• Title: Specify a title for the report.
• Subtitle
: Specify a subtitle for the report.
: Specify a subtitle for the report.
• Flexible settings - total: This field displays the total number of flexible report settings that apply.
• Report for user-defined stacking & blocking
: Specify the data report that contains the user-defined space mapping.
: Specify the data report that contains the user-defined space mapping.
• Automatic coloring
: If you set this field to Yes, default colors are automatically used in the report.
: If you set this field to Yes, default colors are automatically used in the report.
• Show […]: For all space mapping options mentioned below, you can create individual reports, by setting each respective Show […] field to Yes.
In order to view a property's space mapping, you can generate stacking and blocking reports for Space categories, Departments, Department level 1, Department level 2, Department level 3, Department level 4, Space types, Cost centers, Tariff groups (Spaces), Space standards, Free attributes, Space occupancy, Free workspaces or a user-defined report for User-defined space mapping.
In order to view a property's space mapping, you can generate stacking and blocking reports for Space categories, Departments, Department level 1, Department level 2, Department level 3, Department level 4, Space types, Cost centers, Tariff groups (Spaces), Space standards, Free attributes, Space occupancy, Free workspaces or a user-defined report for User-defined space mapping.
Color for unspecified space mapping criteria
: Specify a color to map spaces that are not defined.
: Specify a color to map spaces that are not defined.
• Color for unoccupied spaces
: Specify a color to display empty spaces. These are spaces whose space usage is less than its space dimension. The difference between the total net area of the space dimensions and space usages are also displayed. The empty space is highlighted with the specified color.
: Specify a color to display empty spaces. These are spaces whose space usage is less than its space dimension. The difference between the total net area of the space dimensions and space usages are also displayed. The empty space is highlighted with the specified color.
After specifying the report settings, click OK.
In order to print the report, click Preview & print on the action panel. In the dialog box specify the requirements and click OK.
In order to print the report, click Preview & print on the action panel. In the dialog box specify the requirements and click OK.
Be aware that your browser settings may block pop-ups. |
Click Save as on the action panel to save the report.
In the dialog box, in Output, specify a location to save your report.
In Save as type, specify a type to save the report.
Click OK. A dialog box appears stating that the export is successful.
In the dialog box, in Output, specify a location to save your report.
In Save as type, specify a type to save the report.
Click OK. A dialog box appears stating that the export is successful.
If you open the saved PDF file of the report, you can view individual reports for all previously specified space mapping options:
• Generated Stacking and blocking reports on Occupancy, Free workspaces and User-defined space fields take space dimensions into account, instead of space usage.

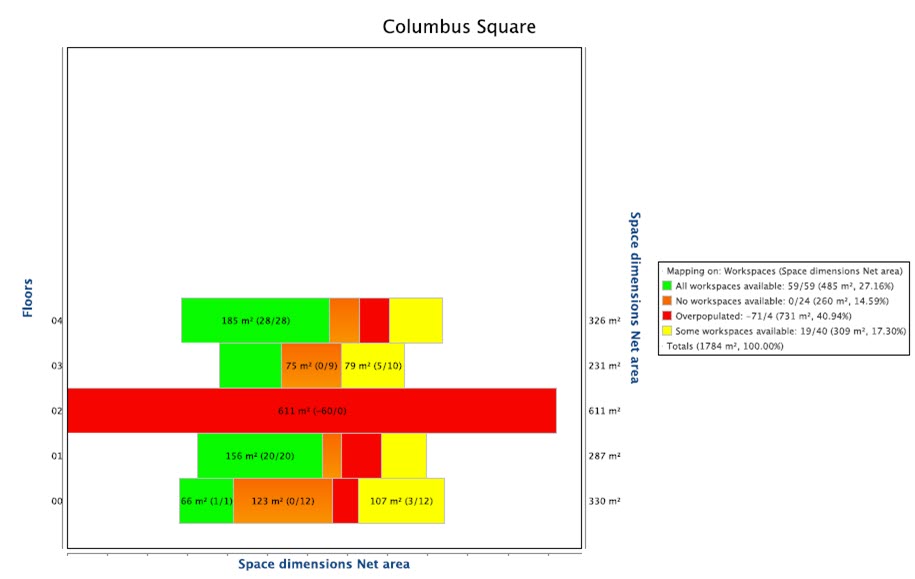
• The Workspaces chart compares the number of workspaces (as defined in the space usage) with the number of persons present in a space. You can view the total number and the available number of workspaces in the report. The following report specifies the available/occupied number of workspaces. Green – indicates that all workspaces are available.
Orange – indicates that no workspaces are available.
Red – indicates that workspaces are over-populated.
Yellow – indicates that some workspaces in the space are still available.
You can view the details in the legend.
Orange – indicates that no workspaces are available.
Red – indicates that workspaces are over-populated.
Yellow – indicates that some workspaces in the space are still available.
You can view the details in the legend.

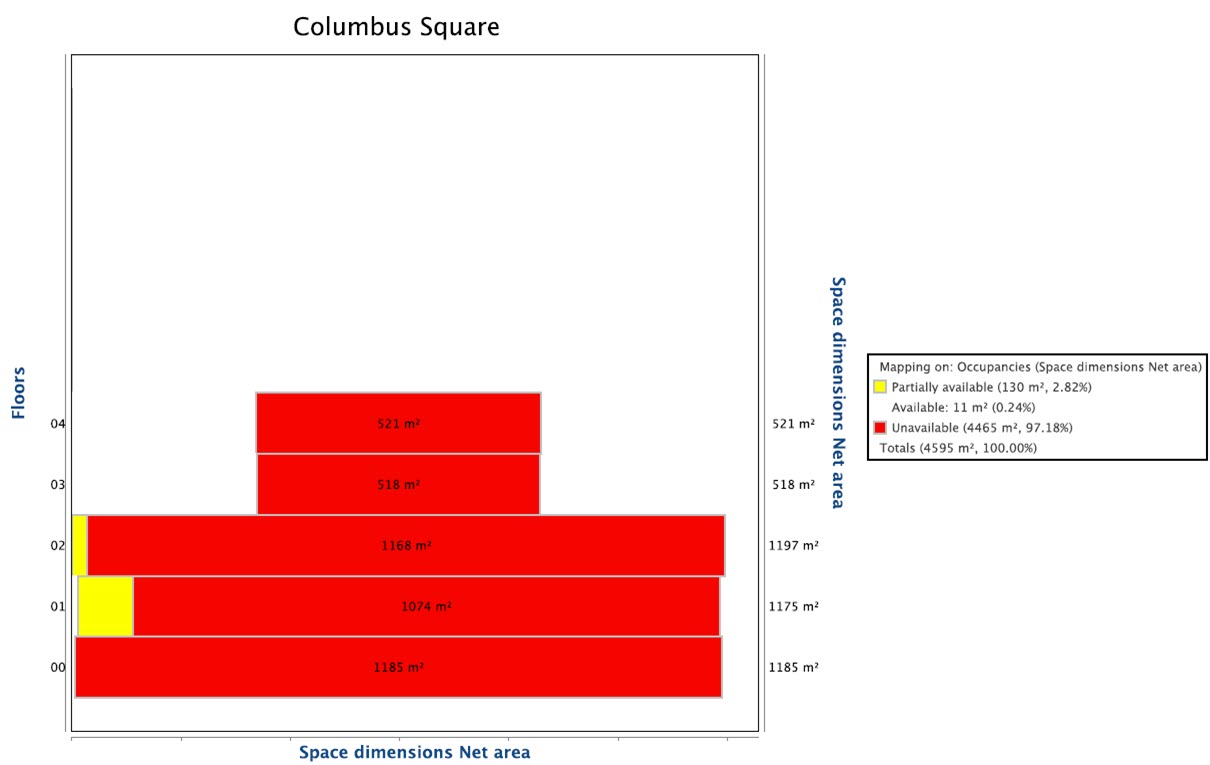
• The Space occupancy chart shows how much net space area is available: the empty or (partially) occupied spaces. Green – indicates unoccupied space area.
Yellow – indicates partially occupied space area
. Red – indicates that spaces are fully occupied, as is the case for most spaces in the following example:
Yellow – indicates partially occupied space area
. Red – indicates that spaces are fully occupied, as is the case for most spaces in the following example:
