Adding Widgets
IoT Platform provides various types of widgets that can be added to a Dashboard, including the following:
• Devices widget – Creates a Thing counter to present all Things or connected Things for specific Thing groups/all Things.
• Last Readings – Creates a counter to show the last reading value sent from the selected Thing for a specified reading type.
• Real Time Readings – Creates a line chart for a reading type sent from the selected Thing.
• Aggregated Readings – Creates a list of readings for specific Device groups/all Device.
• Alarms – Creates a major, minor, critical or warning AlarmInstance counter for specific Device groups/all Devices.
• Alarms List – Creates an editable list of all Application Alarms, filtered according to the Alarm severity and time.
• Reports – Presents a table showing matching report results, based on the specified report query. Only one report can be displayed per widget.
• KPI – Performs aggregation on a Thing’s readings for a specific Thing.
• Gauge – The selected reading is shown in a classic gauge form. You can set the colors for the different zones on the gauge.
• Arch Gauge – The selected reading is shown in an arch gauge form. You can set the colors for the different zones on the gauge.
• Circle Gauge – The selected reading is shown in a circle gauge form. You can set the colors for the different zones on the gauge.
• Command – The widget supports sending a command to Devices that have a push-button type Command defined in the Product.
• Map – Creates a map showing Thing locations for specific Thing groups/all Things.
• Heatmap – Graphically represents readings data on a diagram, where the individual values are represented as colors. The heatmap provides a relative representation of the quantity of values of a certain reading.
• Chart – Creates a chart for one or more reading types sent from a selected Thing.
• Camera Widget – Displays the video input/video stream for a Thing that is a camera.
• All Applications – Counts the number of Applications under the Tenant of a master Application
• Clock – Displays a digital or analog clock by time zone.
• Weather – Displays daily weather, humidity and wind speed by location.
• Properties and Settings – Displays the properties and settings for a Thing.
• Overall Readings – Displays the number of Things of a specific Product type and its Events (readings).
• Last Reading Chart widget- Shows the latest value from multiple readings on a chart.
• Space Utilization Widget – Aggregates data from occupancy sensors and a booking system, returning the percent of time the sensor is in one of four states.
• Floor Plan - Shows Things on a selected Group with fields for selecting Groups and Products.
Each widget has the following buttons (available when you edit a dashboard):
• Delete Widget 

• Edit Widget 

To add a Dashboard followed by widget:
Procedure
1. In the left pane, click Boards.
2. Click New in the top-right. Fill in the Dashboard name and its color scheme and click Done.
Alternatively, open an empty dashboard and click the Edit button in the top-right corner. Then click Add widget.
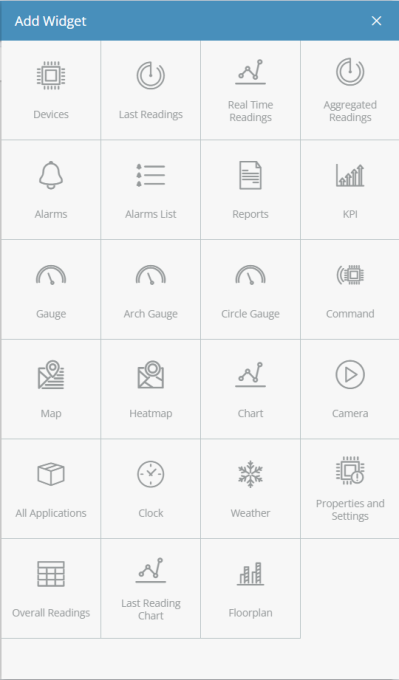
The Add widget side pane appears:

Each box in this window represents a type of widget that can be added to a Dashboard.
3. Click the box corresponding to the type of widget that you want to add.
4. Define the settings for the widget, and then click Done to save the settings. The settings that you specify vary, depending on the type of widget.
For more details about the settings for each widget type, see Widget Settings |
.