Dashboards
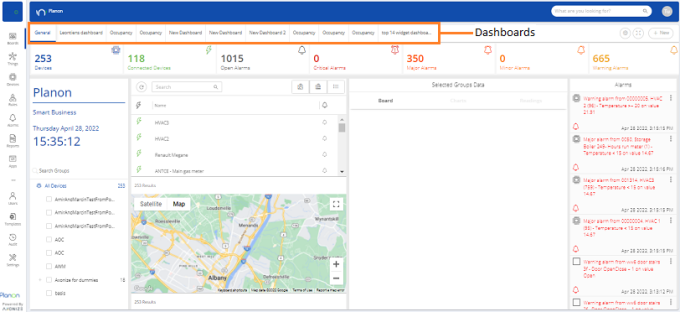
Dashboards provide an at-a-glance view that shows a snapshot of the status of an Application as well as Aggregations and History.
A Dashboard for an Application can contain one or more tabs, where each tab corresponds to a different Dashboard. Simply click a tab to view that Dashboard.

When working in a master Application, the Dashboard reflects all the Devices and Products under the Tenant, meaning those that belong to the master Application. The Dashboard tabs that display are those Dashboards created specifically for the master Application by a user of the master Application.
When working in a non-Master Application, the Dashboard shows the Devices, Products and Reports connected to that specific Application. Dashboards are Application-specific and can only be viewed by users of that Application.

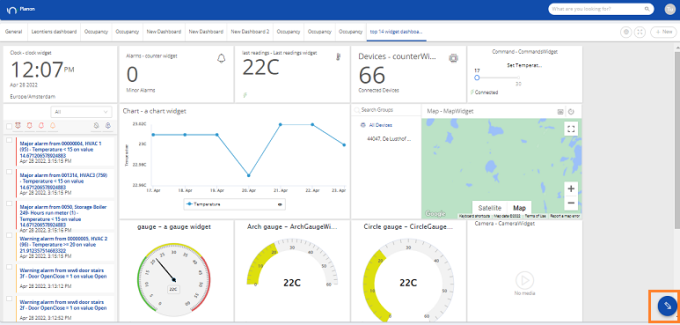
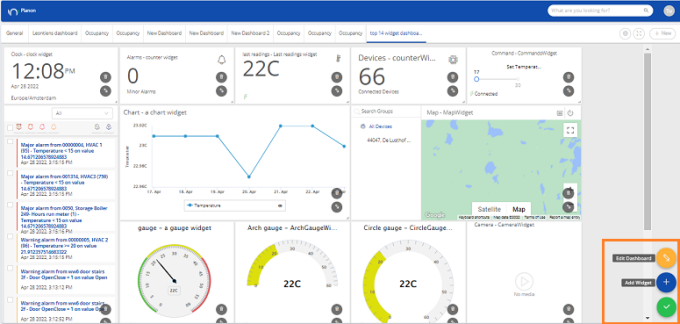
You can click Edit ( ) to display additional options for the Dashboard, as follows:
 ) to display additional options for the Dashboard, as follows:
• Click  to edit the Dashboard. Use this option to change the name of the Dashboard.
 to edit the Dashboard. Use this option to change the name of the Dashboard.
• Click  to exit the edit mode.
 to exit the edit mode.
To change the dashboard to full screen mode, click  Enter full screen button on the top-right corner of the screen. Press ESC to return to the regular mode.
 Enter full screen button on the top-right corner of the screen. Press ESC to return to the regular mode.