Viewing audit logging in Excel
When working with JSON files, Microsoft Excel offers a convenient way to visualize and analyze the data without needing to write code or use specialized tools.
Importing a JSON file into Excel allows you to convert nested data structures into a tabular format, making it easier to sort, filter, and manipulate the information. Once imported, you can take advantage of Excel’s powerful features—such as filtering, conditional formatting, pivot tables, and charts—to explore the data more efficiently and gain valuable insights.
This section explains how to import a JSON file into Excel and display its contents in a readable and interactive format.
Procedure
1. In Excel, on the Data tab, click Get data > From File > From JSON.
2. Browse to your JSON file and click Import
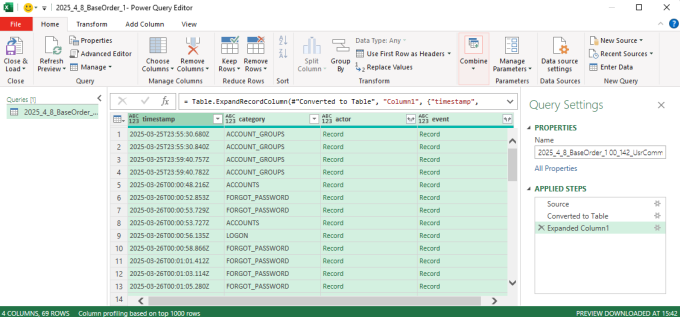
Your file will open in Power Query Editor.
3. Click To Table button on the left to open your file in a table format.
The To Table dialog box appears.
4. Click OK to accept the default settings.
5. In the Column1 header, click the Expand button ( ) and clear the Use original column as prefix check box and click OK.
 ) and clear the Use original column as prefix check box and click OK.
The file looks as follows:

6. In the third column (actor), click the Expand button ( ) and select the Use original column name as prefix check box and click OK.
 ) and select the Use original column name as prefix check box and click OK.
7. Repeat this action for the fourth column (event).
8. Click Close & load on the left.
This will prepare the data and display it in Excel. You can now benefit from using the available Excel functionality to manipulate the data as required.