History past 30 days
The History past 30 days part displays the history of issues of the past 30 days.
Time line
• The thickness of the line is determined by the duration of the incident or of grouped incidents. The duration of the event/issue determines the size of the icon displayed.
Each day block displays a single shape. If multiple occurrences exist on the same day, a priority system determines which one is shown: Maintenance has the highest priority, followed by Major Issues, and then Minor Issues.
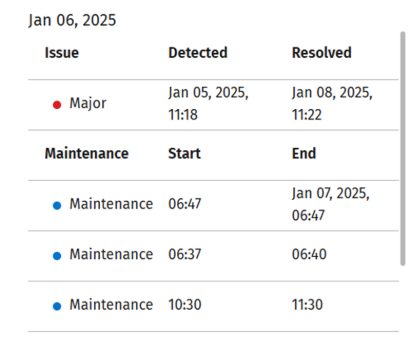
• Mouse over on a day shows all the incidents of that day.
• Incidents at the same time window are grouped in lines that are displayed (size of the event).
• Mouse over on a day that contains multiple major/minor incidents shows the appropriate values.

• Solved incidents stay the same color, but the mouse over pop-up box indicate that the problem is resolved (resolved date is filled in)
• The pop-up box on mouse over shows the start date, start time, end time and current status of the problem: Solved or Working on it.
• The legend explains the meaning of the events:
