Actions on the Graphical CI viewer
• A single click on a node highlights the corresponding CI / asset in the elements list, allowing you to:
◦ drill down from this selected CI /asset to the Asset details selection level
◦ switch to the newly selected asset's data view.
• A double-click or Shift + click on a node displays all the defined relations of that node.
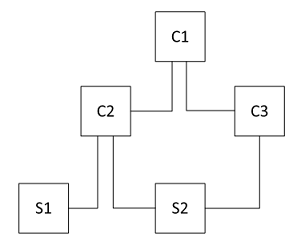
• Click X to hide a node with its direct relations. When a node is hidden, all the nodes that originated from this node will also be hidden. See the following diagram:

◦ Click on C1 will display C2 and C3
◦ Clicking on C2 will display S1 and S2
◦ Clicking on C3 will reveal a relation to S2 (as it is already displayed)
◦ If you hide C2, both S1 and S2 will be hidden
◦ If you hide C3, only C3 will be hidden
◦ If you click on C3 first, only S2 will be displayed. If you subsequently click on C2, S1 is displayed and a relation is established to S2
◦ If you hide C2, only S1 will be hidden (since S2 originated from C3)
◦ If you hide C3, then S2 will be hidden
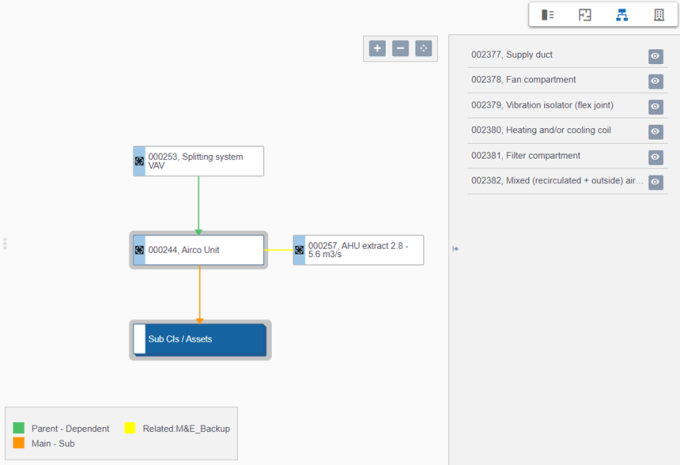
• If there are more than five nodes of the same type, they are grouped together:


• Clicking on the stacked node displays all its nodes on the sliding details pane on the right.

• Clicking on the 'eye' symbol will extract the CI from the group and displays the asset and its relation separately with the main node.