Graphical CI viewer in Assets
The Graphical CI viewer provides a graphical representation of assets/configuration items (CIs) and linked SLA services, and the relations between them.
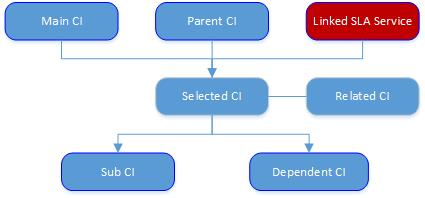
The following relations can be shown for a selected asset / CI and linked (SLA) service:
For a selected CI:
• Main CI / Sub CI
• Parent CI / Dependent CI
• Related CI
• Linked SLA service
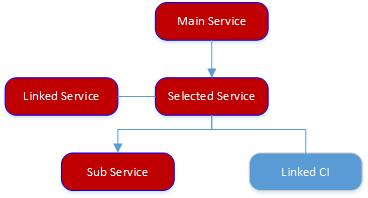
For a selected SLA service:
• Main service / Sub service
• Linked CI
• Linked service
• For Related assets, you must first define Asset relation types in Supporting data . • For linked services to be shown on the Graphical viewer, an asset / CI must be linked to a relevant service via the Link services action on the Assets action panel. |
In the Graphical viewer, the hierarchical arrangement of the CIs (assets) and (SLA) services (depending on their mutual relations) is displayed in the images given below:


In the Graphical viewer, CIs / assets are represented by graphical units called nodes, which are connected by lines that represent their mutual relations. The Parent – Dependent and Main – Sub relations are represented by an arrow, which always points to the dependent/sub asset. All other relations are represented by a straight line.
The Graphical viewer is not available for Building elements. |