Understanding the Graphical CI viewer
Select a CI / asset in the Assets Pro TSI on the Assets selection level. From the views available above the action panel, select Show CI viewer actions.
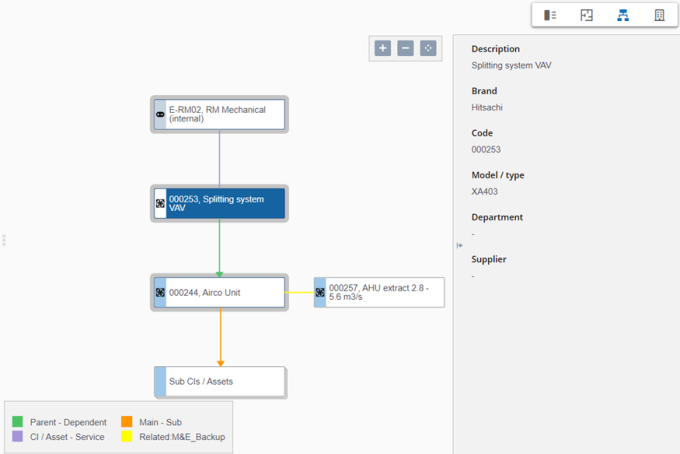
The selected CI / asset is displayed as a main node in the Graphical viewer.

The following features are available on the graphical viewer:
1. A toolbar with Zoom out, Zoom in and Fit to screen buttons.
You can also use the mouse wheel to zoom in and out.
2. A sliding pane (details panel) on the right, displaying the details of the selected node. The details are obtained from Data only user reports. The report must be selected in the > and Data only report – SLA details fields.
For more information on selecting data only user reports, see Configuring Graphical CI/Asset viewer settings. |
3. A legend, showing the colors that represent the different relation types between the assets and services on the Graphical viewer.
4. Double-clicking on a node displays a diagram of configuration items / assets, services and their mutual relations.

5. Selecting a CI / asset node highlights the corresponding CI / asset in the elements list, allowing you to drill down from this selected CI /asset to the Asset details selection level. You can also switch to the data view of the newly selected CI / asset.