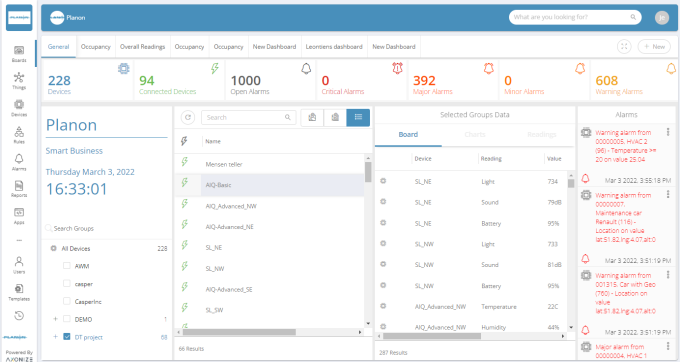
Default Dashboard
Each application automatically has a default, General Dashboard. This Dashboard cannot be modified.

The default ready-made General Dashboard contains the following sections:
• Devices Pane: List of all connected Devices in a map or a combined view.
• Detailed Pane: Current readings, Charts tool and a last readings list for each Device.
• Application Overview: Device and Alarms counters on top, last events list on the right.