Summarization update process
A summarization process can be launched manually or can be triggered by the Planon scheduler.
Historical data will be stored as actual readings or as summarized data. Both types will be processed by the summarization process.
During the summarization process the following steps will be performed:
• Delete actual data if the number of days exceeds the Days for storing historical readings (DaysOfActualReadingsToStore) setting. Older data will be purged.
• Update summarized data for hour-, day- and month summarization. Summarized data is processed for measurements up to and including today -1 (yesterday).
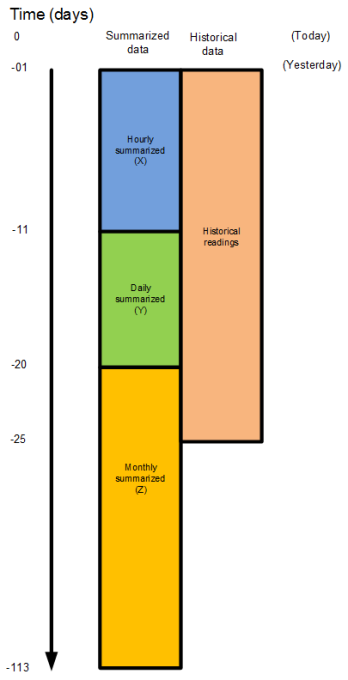
Summarization is performed chronologically, starting today -1 day (yesterday) and going from this point backwards, as is shown in the following figure:

• These data sets do not overlap. As shown in the figure above, these represent consecutive time blocks. • Historical data and summarized data differ in detail. By virtue of compression, the summarized data, logically, contain fewer information compared to the historical data. The summarized data is used by AWM Dashboards and by (internal and external) business intelligence tooling. Historical data can be viewed and analyzed in Planon itself (by using reporting in Planon). |
Explanation
In order not to miss any data, make sure your historical readings are kept for a number of years! In the example (earlier), we used the following periods: • Hourly summarized readings are kept for 10 days. • Daily summarized readings are kept for 9 days. • Monthly summarized readings are kept for 3 months. • Historical readings are kept for 25 days. |
For historical data, records are only added if a change in the reading data occurred. All AWM dashboards are based on summarized readings: • When viewing year and month, data of all three time blocks is used. • Zooming in to days limits the view on the data set to the period that hour and daily summarized data was stored (in the above example: X + Y). • Zooming in to hours limits the view on the data set to the period that summarized data was stored for hours (in the above example: X). |
Consequently, the choice of the summarized periods influences the detail and zooming options of your summarized data. At the same time, it helps you prevent an overflow of your storage capacity.