Viewing performance monitoring data
The Performance data section displays the performance monitoring data according to the settings made in the performance monitoring fields. The unit of time used to measure performance is milliseconds.
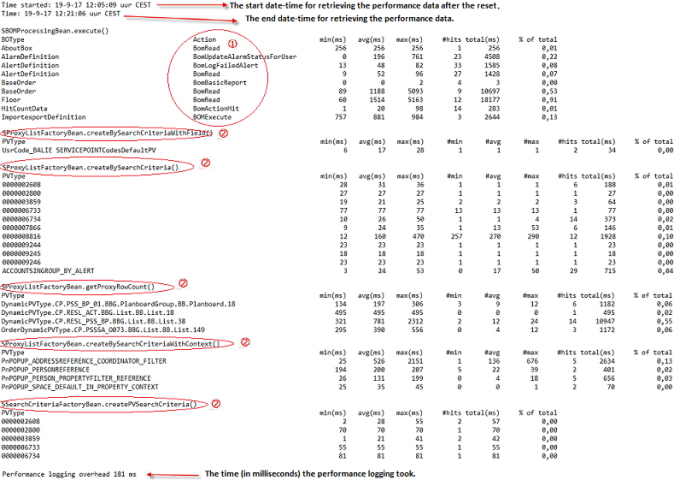
The following image shows the data that is displayed in the various rows and columns:

1 = Logged actions
2 = Logged queries
Reported values
min(ms): Minimum execution time (milliseconds)
avg(ms): Average execution time (milliseconds)
max(ms): Maximum execution time (milliseconds)
#min: Minimum number of records returned
#avg: Average number of records returned
#max: Maximum number of records returned
#hits: Total number of executions/hits
total(ms): Total time of the total number of executions/hits
% of total: Expressed as a percentage of all performed actions