Generating dashboards for sustainability monitoring
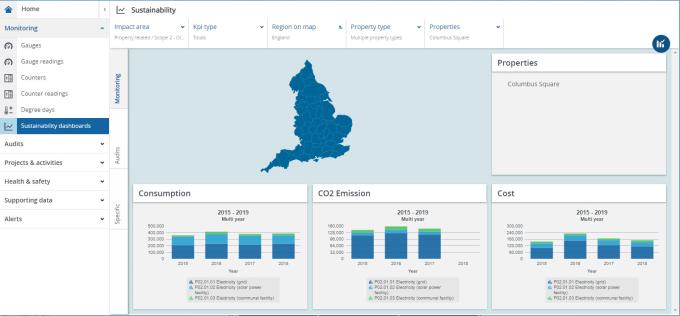
You can retrieve data on your buildings’ or department’s energy consumption, costs and CO2 emissions in a bar chart. This allows you to immediately identify excessive consumption, emission or costs in your building portfolio and gives you a clear view on the interrelationship of these aspects.
Procedure
1. Go to > and log on.
Note: this procedure serves as an example for the many dashboards you can generate here.
2. On the Planon Sustainability dashboard web page, click the vertical Monitoring tab (left-hand side of your screen).
3. In the horizontal selection bar, select Impact area.
You can choose whether your impact area should be Department related or Property related.
4. Select Property related.
5. Select a scope. You can choose between scopes with a direct or indirect impact on your sustainability.
6. Select Scope 2 – Direct- Electricity.
7. Select a KPI type, which determines the way KPIs are presented: as totals, per workstation, per m2 of rentable floor area or per headcount.
8. Select Totals.
Note that the countries on the map turn green and can now be selected.
9. Hover over the map and click Europe > United Kingdom > England.
10. Go to the horizontal selection tab Property type.
11. Hover the cursor over the options and select Building and Infrastructure. Both are highlighted. Notice that the text under the vertical selection tab is Multiple property types.
12. Go to the horizontal selection step Properties. Hover your cursor over the text and select Columbus Square.
13. The Prepare charts button turns blue now.

14. Click the button.
The dashboards will show data on the selected property, such as the electricity consumption, CO2 emissions and costs over 5 years.

For more information about configuration and a more detailed description, see also: Sustainability and REM dashboards. |