Using the SSP planboard
Goal: To allocate the demand by departments to buildings and floors (match demand side with the supply side), based on the selected SSP data.
Make sure that your demand and supply records in your SSP project have been completed. Then go to the Scenarios TSI and select the relevant SSP project. |
To match demand with supply, proceed as follows.
Procedure
1. At SSP scenarios, select the required scenario.
2. Go to Planboard - Linked properties > Planboard.
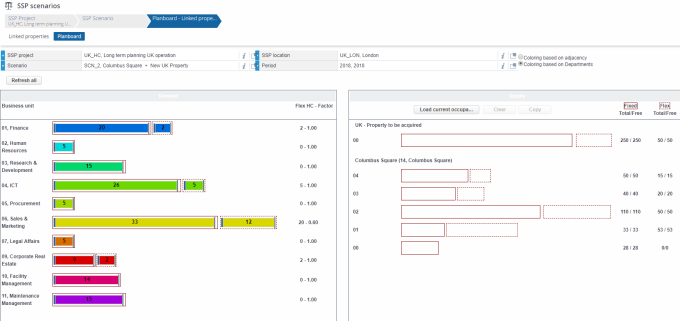
3. In the SSP planboard, select the required project, scenario, location and period. By default, the type of coloring is based on department. Based on these settings, the planboard data is generated:

The left side of the screen displays your demand information (headcount per department for the selected period); the right side displays the supply information (available buildings and floors for the selected period).
4. If you prefer to take the current occupancy of properties and floors as starting point for planning, click the Load current occupancy button at the top right side of the screen.
After clicking this button, the current floor occupancy – for the selected period – is loaded per floor, per property.

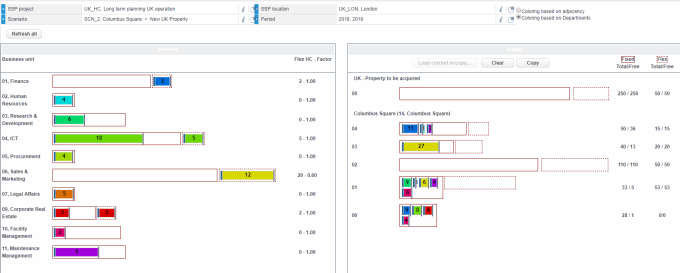
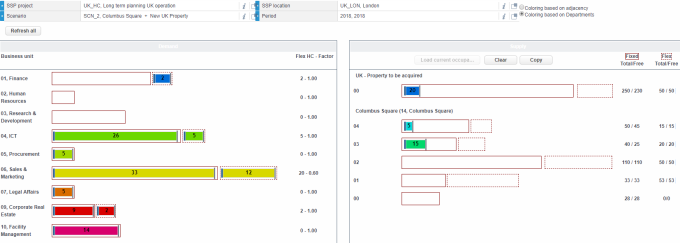
5. In order to assign departments to buildings and floors, use drag-and-drop to move fixed and flex headcount from the Demand side to the Supply side (SSP properties and floors). Pick up the colored blocks by the little blue bar on the left, and drop the block by placing your cursor in the center of the box (floor) to which it must be assigned.

By default, the full headcount of the departments is displayed in the bars on the Demand side. If you don’t want to move the full headcount of a department to the Supply section, but only part of it, click in the bar to activate a slider which can be moved to decrease/increase the headcount to the required number.
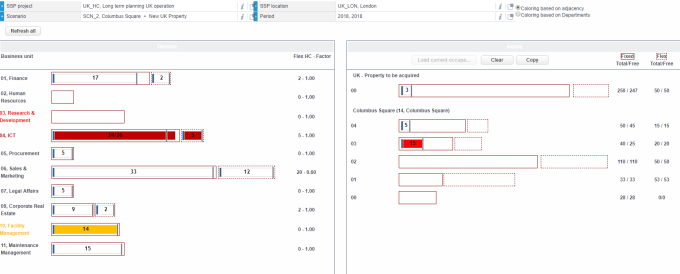
6. After you have finished your planning activities and you are satisfied that the data is as you intended, you can check whether the adjacency fit was taken sufficiently into account for each department, by clicking the department description on the Demand side, for example the ICT department, followed by clicking the Coloring based on adjacency button.
7. The color scheme based on adjacency appears, indicating whether you have done a good job for the selected department. In the default settings, a red color means that adjacency is highly important, orange means that nearness is still quite important, a gray color means that it isn’t important at all.
See the Strategic Space Planning installation guide for information on defining settings for the color schemes in the SSP planboard. |
8. If necessary, make changes for this department by moving headcount to more suitable locations.
9. If required, check the adjacency fit for all departments, the same way as in steps 6, 7 and 8.
The example shows what the best option for ICT is in the selected period:

10. Once you have finished, you can copy the planboard data to the next period, for example from Quarter 1 to Quarter 2, as a starting point for planning Quarter 2.
11. You can also use the copy functionality to copy planboard data to another scenario or location. Attention: existing data in the selected scenario / location / period will be overwritten.
If your planning activities are not as you intended, or if you get stuck, don’t copy the data, but click the Clear planboard data button and start over with your planning.
12. If you have finished creating planboard data for all periods in your scenario, you can check how your planning affected the Adjacency fit KPI per period, by going back to the Planon ProCenter > Scenarios TSI.