Cash flow
The screen Financial Statements – Cash flow (see the following screenshot) lists the calculated Financial Plan amounts over time for the Entity according to the financial structure.

Example - Screen: Financial Plan – Cash flow (collapsed view)
The time axis can be zoomed in and out by two ways:
 zooming in from 1 specific year to quarter and thereafter to month level
 zooming in and out all periods up to year, quarter, or month level in one go
Next to that, also the Financial Structure can be fully expanded or collapsed in one go to the selected level (up to 10 levels available) using the  buttons in the first column. See the following screenshot.
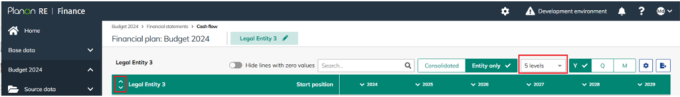
The following screenshot shows an expanded time horizon (up to quarterly level) and Financial Structure (till level 5).
")
Example - Screen: Financial Plan – Cash flow (expanded view)
For both Reaforce Projects/ RE Assets objects and Excel Projects, by clicking on the project it is possible to open a new screen showing the cash flow forecast for the specific project. The following screenshot shows the possibility to drill down, the subsequent screenshot shows the screen after drilling down.
")
Example - Screen: Financial Plan – Cash flow (drill down on a project)
")
Example - Screen: Financial Plan – Cash flow (drilled down on a project)
By clicking on the Entity name at the top left of the screen it is possible to return to the Cash flow screen of the Entity.

You can view the financial statements either with considering the underlying subsidiaries (Consolidated view) or without considering these subsidiaries (Entity-only view).
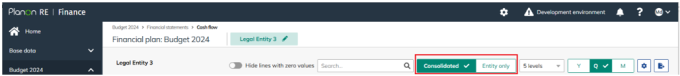
When the view is:
• Consolidated: subsidiaries (underlying entities) are fully included; Investment in Subsidiaries is 0.
• Entity only: subsidiaries (underlying entities) are only included as Investment in Subsidiaries in the figures.
Additionally, you can click  to select another view.
to select another view.Options are:
• Traditional view: shows the financial statements without aggregated values (values are shown per entity per project)
• Controller view: shows the financial statements with aggregated values at underlying cash flow levels of all projects, objects, and Excel imports.