Opening the graphical planner
Procedure
1. In Projects, go to the Project items selection level.
2. Click the Graphical planner icon ( ).
).
 ).
).The planboard opens, displaying all key components.

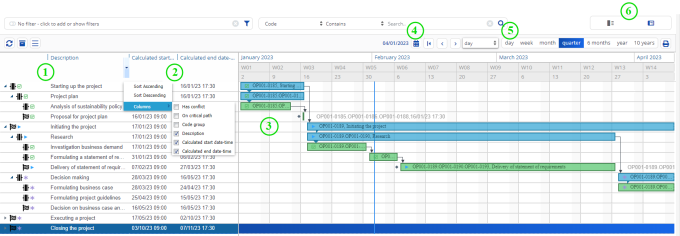
The individual components of the Graphical planner are explained in this table.
Component | Description |
|---|---|
1 - WBS items panel | Displays a hierarchical list of WBS items and subitems, including their scheduled start date-times and end date-times. |
2 - Column headers & sorting options | Column headers represent relevant fields of the WBS items. You can configure visible columns and select sorting options using the shortcut menu. |
3 - Planboard interface | The main planning interface where WBS items are visually represented: • Horizontal bars for tasks • Diamonds for milestones (zero-duration as standalone diamonds, non-zero duration as diamonds on bars) • Arrows for dependencies, such as ‘Finish-to-Start’ relationships • Tasks can be resized or moved by dragging their bars, automatically adjusting dependent tasks. |
4 - Date picker | Allows you to select a specific date to view relevant WBS items. By default, the planboard displays tasks from the current system date. |
5 - Time scale & navigation controls | You can adjust the displayed time period by selecting: • day • week • month • quarter • 6 months • year • 10 years The navigation buttons Previous and Next allow movement along the timeline based on the selected period. |
6 -View selection buttons | Allows you to switch between the Graphical planner view and the Data view for different perspectives on project progress. |