Viewing device data
By establishing the link between a device and a digital twin, the data that is received from the device in the IoT Platform is now also available for viewing.
You can view the detailed data in the IoT Platform 's Group template, but you can also view the aggregated data in the Planon application.
Procedure
Here, assets is used as an example. The Digital twin view is available in the TSIs Meters, Asset Pro, Spaces & Workspaces (Floors, Zones). |
1. Go to Assets and select the digital twin to which you linked a device earlier.
2. Click the Digital twin view.
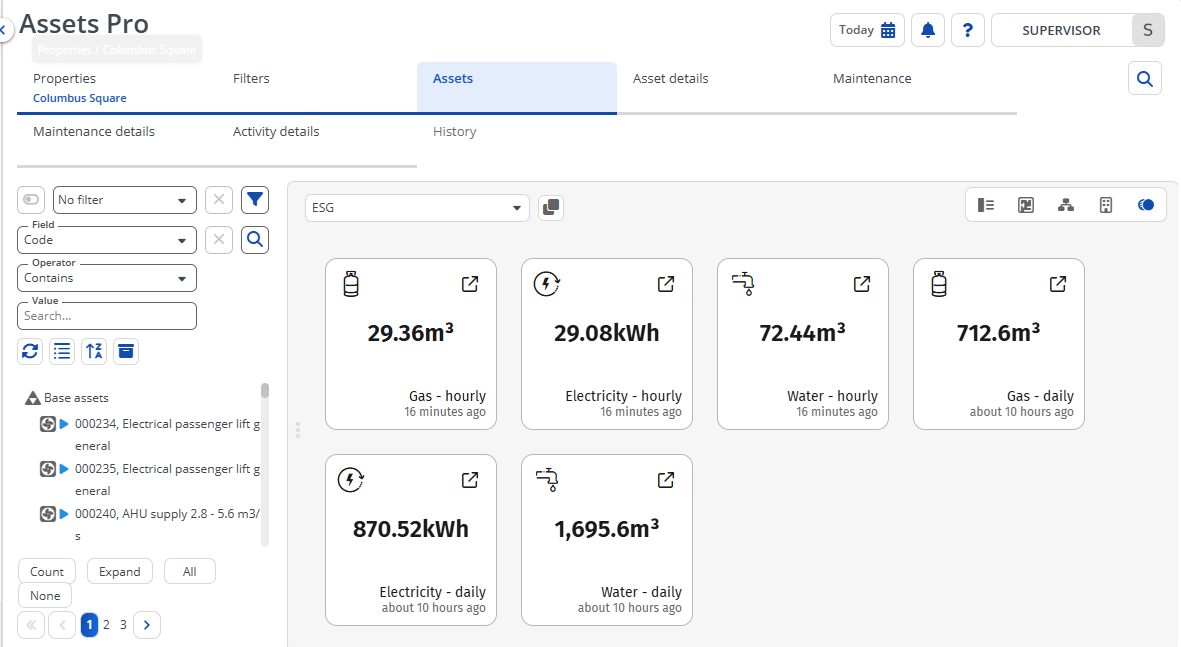
If multiple digital twins have been created for a business object, you can select the relevant digital twin use case from the drop-down menu at the top of the screen. In the example below, the ESG use case is selected, and its associated data points are displayed in the data panel.

The Digital twin view displays the specific measurements of the digital twin (events configured in the IoT Platform ) of when the data was last updated (last reading). |
Pop-out
If you click the Pop-out button ( ) next to the drop-down box on the top, your data points will be shown in a separate window.
 ) next to the drop-down box on the top, your data points will be shown in a separate window.
The pop-out feature is linked to the digital twin definition. This means it can only display data points if the digital twin definition you switch to is associated with the same use case.
Viewing historical data
When you click the  (View historical data) button on a tile, the data is either displayed as a:
 (View historical data) button on a tile, the data is either displayed as a:
• Line chart
Available for readings of numerical values (integers, decimals).
• Bar chart
Available for non-quantifiable data (allowed values, such as high/Low) - this will display a count.
At the top of the charts, you can specify the time frame for the data that you would like to see displayed.