Algorithm
The Performance score is based on a data computation, an algorithm that results in a statistical distribution of data.
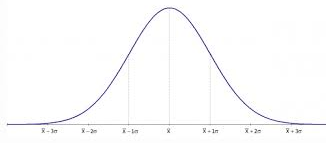
The algorithm that you apply is free-definable. A typical use case would be to apply an algorithm that results in a normal distribution of data. When represented in a chart, such an algorithm would result in bell shaped curve, also called a Gaussian curve:

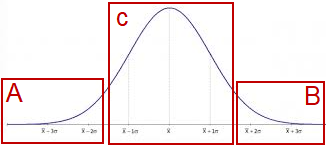
A classification of such data could result in three categories:

• Bad performing (A)
• Well performing (B)
• Good performing (C)
This analysis enables you to quickly identify and learn from what is going well (B) and apply this on what needs to improve (A). Gradually, in a process of continuous improvement, the performance shifts to the right and the performance is more even resulting in a narrowing graph. |