Views
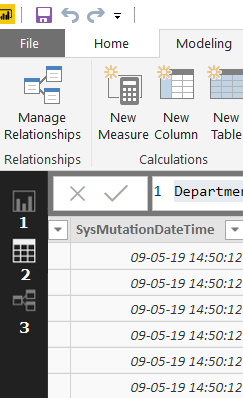
PowerBI features three main views, featured in the left panel.
 | 1. Report view: where you use queries to build visualizations. 2. Data view: where you see the data in your report in data model format (much like Excel). Here you can add new columns and caculations. 3. Relationships view: where you get a graphical representation of the relationships that have been established in your data model. |
In The Data view, you can use the edit query mode, which is how you can model the data retrieved from Planon. The query language used here is slightly different. When you add a filter in edit query mode, it is "fixed" and will be applied every where and each time you refresh your data. If you add a fitler in Data view, it is only applied in that view.