Using dashboards
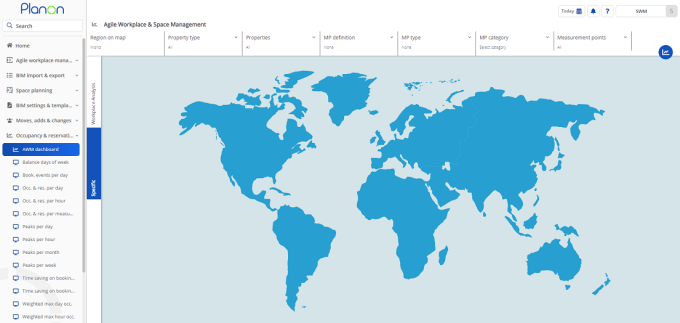
1. The filter bar on top allows a wide range of filter attributes that you can use to fine-tune your view by choosing your selection criteria.

Filter attribute | Description | ||
|---|---|---|---|
Region on map | Select a specific region on the map that is displayed. All properties that are linked to that region based on the property Dashboard area are selected. The chart will display all locations with measurement points linked to one of the selected properties. | ||
Property type | Select properties based on their (user-defined) types. You can select multiple property types at once. The chart will display all locations with measurement points linked to one of the selected properties of these types. | ||
Properties | Select properties in a drop-down list. You can select multiple properties at once. You can select multiple properties at once. The chart will display all locations with measurement points linked to one of the selected properties. | ||
Measurement point definition | Select measurement points based on their definitions. You can select multiple measurement point definitions at once. The chart will display all locations with measurement points linked to one of the selected measurement point definitions. | ||
Measurement point type | Select measurement points based on their type. You can select multiple measurement point types at once. The chart will display all locations with measurement points linked to one of the selected measurement point types. | ||
Measurement point category | The measurement point category is the only mandatory filter and contains a fixed list. All the different categories have their own specific set of charts.
The chart will display all locations with measurement points linked to the selected measurement point category. You can only select a single category (no multi-select). • Bookable space units Reservation units – rooms • Bookable flexible workspaces Reservation units – desks • Non-bookable individual workspaces Workspaces • Non-bookable areas All other location types (properties, floors, zones, spaces, rentable units) | ||
Measurement points | The list with all measurement points (locations) based on all selections are shown in a drop-down list. Here, you tweak your selection on a single or set of measurement points. You can select multiple measurement points at once. |
2. After completing your selection, click Prepare Charts:  .
.
 .
.Your chart will appear.
By clicking in the chart area, you can further zoom to display chart details.
After zooming in, you can click Level up to zoom out one level.
By clicking a legend item, you can switch off/on its graphical representation in the chart area.