Setting up an AWM dashboard
AWM dashboards allow you to visualize various analytics with specific filtering options. The charts can be zoomed in from:
• Years
• Month
• Days
• Hours
Preparations
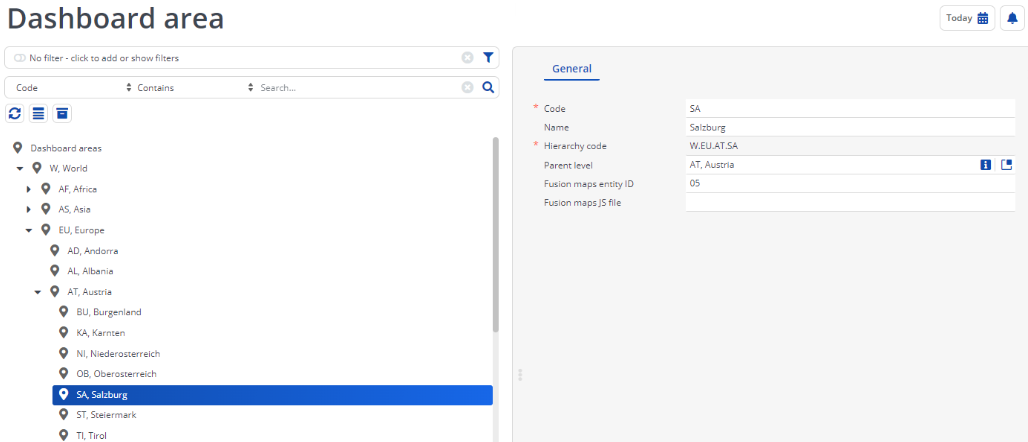
• Check whether the TSI Dashboard area is visible and contains data:

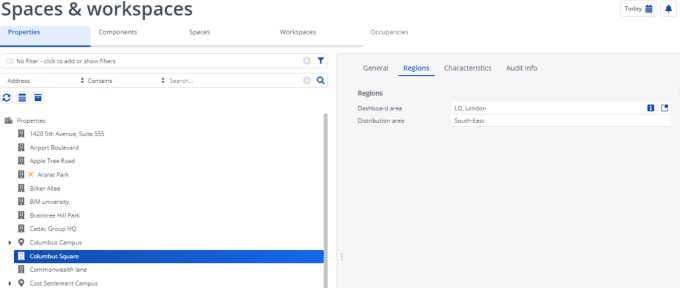
• Add a dashboard area for your properties:

• Make sure the summarized readings of measurement points are up-to-date – you can do this by daily scheduling the summarization (via an action definition).
In the AWM dashboards, all charts in the dashboards are based on the Summarized readings of measurement points.
Creating the dashboard
Complete the following steps to create a dashboard:
Procedure
1. Go to Web configuration > Agile Workplace and Space Management.
2. Click Add to create a new dashboard.
A set of hierarchical Publisher charts is created. Complete the required fields:
Field | Description |
|---|---|
Available dashboard pages | Specify which of the available dashboard pages should be shown: • WorkplaceAnalysis • Specific Valid value could be: WorkplaceAnalysis,Specific |
Number of years | Specify how many years in the past data will be shown. Valid value could be: 4 |
Default region | Specify which part of the world is shown on the map at start-up. The dashboard areas are shown in a drop-down list. Valid value could be: W, World |
Show utilization charts | Specify whether a Utilization chart must be added to the list (Yes). |
Other settings ... | All other settings are standard Publisher Charts configuration, |
3. Add the Dashboard to a navigation group in your navigation panel.