Data selection
Dashboard supports flexible aggregation by time to track trends like week-over-week, day of the week, or by hour of the day, allowing quick analysis at your fingertips. Customers are no longer required to download the data and do complex data analysis using spreadsheets.

1. Live, provides near real-time view of your portfolio based on data captured from your sensor system.
2. Day, provides insights of measured values of a specific day (in history) usually displayed in an aggregate of hourly values.
3. Week, provides insights of measured values of a specific week (in history) usually displayed in an aggregate of daily values.
4. Month, provides insights of measured values of a specific month (in history) usually displayed in an aggregate of daily values.
For all Fusion charts, you can export the chart data in PNG, JPG, CSV, SVG, or PDF format. 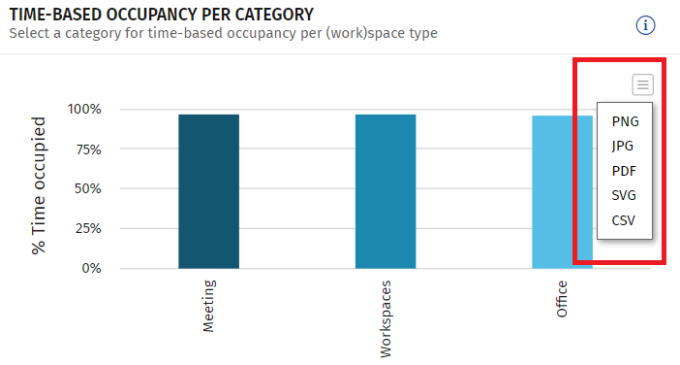 |
In the week and month views of Flow charts, the Absolute Peak Occupant Count is presented as a line chart. |