Deep dives
Each Planon Workplace Insights module has a corresponding Deep dive section.
These are charts that have been specifically designed to enable workplace strategists to
• Analyze a broader trailing 12-month data set to make strategic decisions about their RE & workplace portfolio.
• Aggregate or combine data for multiple properties to get a bird’s eye view of the selected portfolio.
• Benchmark properties to analyze time-based occupancy and net utilization metrics.
To populate these charts, please note that you require a valid filter. |
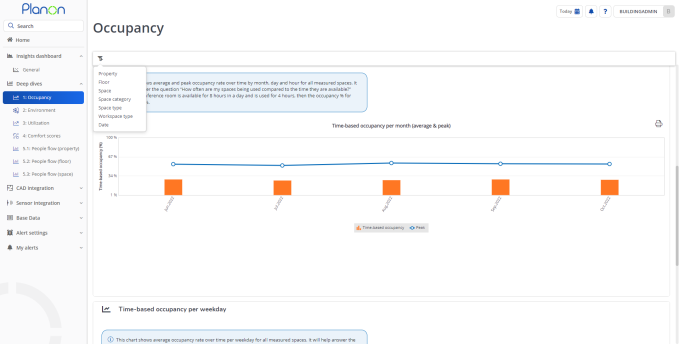
Occupancy
The following screen capture is an example of the Occupancy deep dive, displaying the occupancy and daily peak values in one chart.

Note that you can further zoom into details by using the filtering options available. |