Peak values
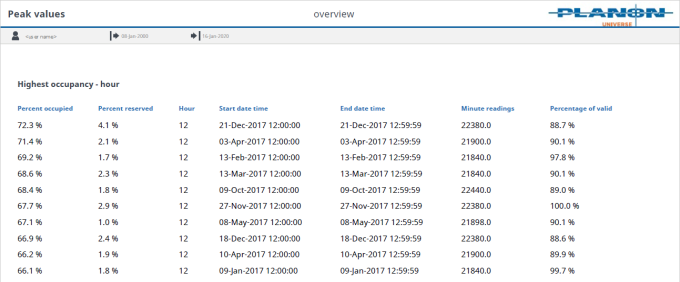
The Peak values report provides an overview of the highest occupancy percentages by unit of time. The results are listed in descending mode (highest on top).
The report is instrumental in gaining insight into the usage of your workspaces and reservation units. The calculation is based on the available time during office hours.
Example
Field | Description |
|---|---|
Office hours | 08:00-18:00 (10 hours / 600 minutes) |
Valid readings | 600 minutes |
Occupied | 395 minutes |
Time occupancy percentage | 395 / 600 * 100 = 65,8% |
Report overview
The report displays the following information:
• Highest occupancy peaks (by month/week/day/hour)
Displays the highest peaks by time unit for the selected measurement points and period. The data is displayed in columns (see Report columns).
• Highest occupancy by measurement point (by month/week/day/hour)
Displays the highest occupancy peak by measurement point and time unit. The data is displayed in columns (see Report columns).
