How people flow works
People flow is a specific implementation - here you can read how it works
The values are captured on measurement point (exactly the same as on measurement point readings). These captured readings represent real-time values and they are displayed as a summed, incremental value for the whole day, which started with a reset.
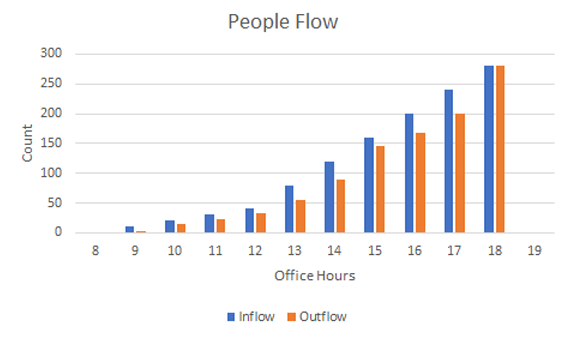
Consequently, if you would display it graphically, it would resemble the following figure.

This is true for both the People in and the People out readings, so, theoretically, both readings would be the same at the end of the day (the number of people inflow and outflow is the same).
Summarized readings
Subsequently, the readings are passed on to the summarized readings (hourly, daily, monthly).
Hourly summarized readings
The values displayed as hourly summarized reading represent incremental values. This is best explained by an example.
To calculate the hourly summarized reading, the application looks at two values:
• The last reading of the preceding hour (X1)
• The last reading of the current hour (X2)
The calculation is X2-X1. |
Readings | People in (Measurement point reading) | Hourly summarized reading | |
|---|---|---|---|
8:59 | 10 | 10 | 8:00-8:59 |
9:45 | 15 | 5 | 9:00-9:59 |
10:10 | 65 | 50 | 10:00-10:59 |
11:30 | 100 | 35 | 11:00-11:59 |
Daily summarized readings
Daily summarized readings is the sum of all hourly summarized values.
Monthly summarized readings
Monthly summarized readings is the sum of all daily summarized values.